New York City: The Three 'I's of Poverty

The typical story about poverty focuses on what fraction of individuals are poor. Economists are interested in more than this, however, and the classical ways of measuring poverty are the:1
- incidence of poverty (what proportion of the population is poor?)
- intensity of poverty (how poor are the poor?), and
- inequality of poverty (how unequal is the distribution of mild, moderate, and severe poverty?)
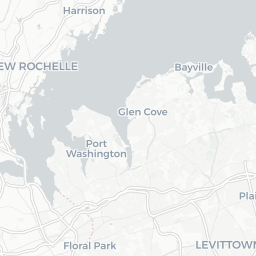
The interactive maps below detail the above poverty measures for all 55 of New York City’s neighborhoods.
Following up on previous posts about Brownsville, the ways it differs from the rest of NYC, and the ways the poor in Brownsville differ from the poor in the rest of NYC, I’ll highlight Brownsville / Ocean Hill in the interactive maps below.
The Incidence of Poverty
Among all the neighborhoods in New York, you can see that Brownsville / Ocean Hill has one of the highest rates of individual poverty, with a rank of 11 out of 55 where 1 represents the worst neighborhood on this poverty measure.


in Poverty
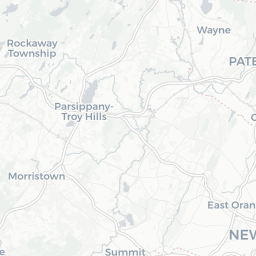
The Intensity of Poverty
Furthermore, the average poverty level among the poor in Brownsville / Ocean Hill is comparatively low, with a rank of 2 out of 55 where 1 represents the worst neighborhood on this poverty measure.
of Individuals
in Poverty
The Inequality of Poverty
Furthermore, the inequality among the poor in Brownsville / Ocean Hill is comparatively high, with a rank of 9 out of 55 where 1 represents the worst neighborhood on this poverty measure.
among Individuals
in Poverty
Sen, Amartya K. 1976. “Poverty: An Ordinal Approach to Measurement.” Econometrica44 (2):219–31. More can be found here: https://siteresources.worldbank.org/INTPA/Resources/429966-1259774805724/Poverty_Inequality_Handbook_Ch04.pdf↩
Joseph de la Torre Dwyer
Researcher
My research interests include distributive justice; the principles of responsibility, desert, and control; and reproducible research with R.