Asymmetric Marriage Algorithms: NYC School Placement
Each year, hundreds of thousands of kids apply1 to New York City’s public school system with a ranking of up to twelve schools. The Department of Education then matches all of these students up with a single offer from one of NYC’s 1,800 public schools,2 ensuring maximum satisfaction for the applicants. How does it work?
At first glance, my intuition was that this was a really complex problem. After watching this fantastic video, I then sketched out the algorithm in a notebook and came to believe that it was pretty simple.3
The idea is to make an ordering of students for each school based on the school’s priorities.
For example, the school might put “applicants who reside in the school’s zone and are siblings of current students” followed by “applicants who reside in the school’s zone.”
Another school might state as its first priority “applicants who reside in the scool’s district,” where a district contains multiple zones.
All applicants are also linked to a unique applicant number which is used to order students within a priority.
Student 0000001 will always be first in their priority (e.g., “applicants who reside in the scool’s district”) but they may be in a particular school’s fourth priority.
The algorithm then asks of each student at the head of each school’s ordering, did you rank this school higher than any other school for which there are still seats?
If the answer is Yes, the student is offered a seat at that school and they are removed from the student ordering at all other schools—allowing students behind them to move up one place.
Parameters
In the video above:
- I made an applicant population of 1,250 students for 50 different schools with an expected average of 24 seats per school.
- All students made 12 out of 12 possible rankings from among the 50 schools.
- An expected 80% of schools (82% observed) would have siblinghood included in their first priority.
- An expected 30% of students (38% observed) had no sibling.
- An expected 43% of students (76% observed) had a sibling in the same zone as the student.
Results
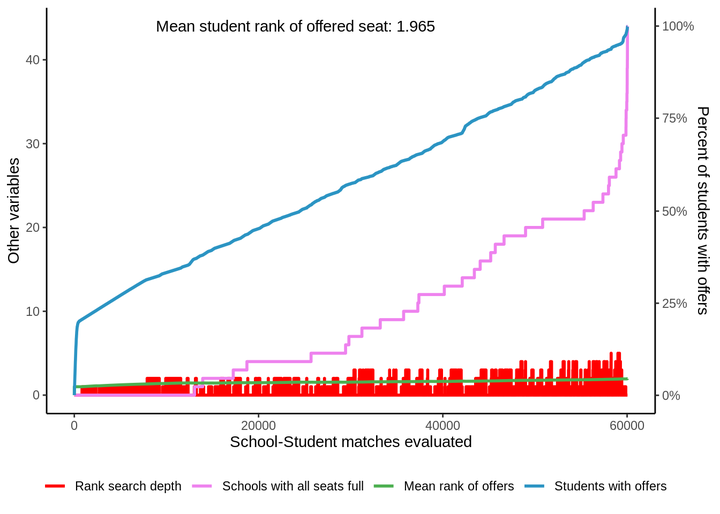
As it turns out, 10 students were not initially offered a seat.4 But, surprise, there were 1,292 seats available! The leftover students were too far down in the ordering of students at the schools these students ranked. The remaining schools with seats are: 20, 24, 25, 28, 34, 39, 41, 42, 44, 45, 46 but the students’ remaining preferences are for these schools: 1, 2, 3, 4, 5, 6, 7, 8, 9, 10, 11, 12. Impressively, the mean rank students gave for the seats they were ultimately offered was 2.107. If we imagine leftover students ultimately receive their rank 13, this brings down the mean rank to 2.194.
A Twist
But what if we ordered students within a school’s priorities not by the applicant number, but first by the student’s rank of this school and then their applicant number?
Student 0000001 would no longer always be first in their priority for each school for which they provided a ranking.
If we do this, it turns out that we can finish our algorithm faster, make offers to more students, and provide a better mean rank.5
Of course, it’s possible that the NYC Department of Education already does this (which wasn’t clear to me in their video) and it’s possible I have some errors in my algorithm,6 but this seems like it would benefit NYC students.
In this student-ranking alternative method, we only evaluated 60,042 school-student matches, 1 student(s) was(were) not initially offered a seat, and the mean rank students gave for the seats they were ultimately offered was 1.968. If we imagine leftover students ultimately receive their rank 13, this brings down the mean rank to 1.977. This constitutes an improvement of 23.0%, 0.7%, 12.6%, and 18.2%, respectively.
Incomplete Preferences
To be more realistic, I generated a second scenario that had some students rank only 2 schools, some 3, etc., until some rank a maximum of 12 schools. My intuition was that students with more schools ranked would end up with better ranked offers. In this scenario, 1054 students were not initially offered a seat. The mean rank students gave for the seats they were ultimately offered in this standard method was 1.224 (11.154 if unmatched students receive their rank 13).7
In this scenario, now using the student-ranking method, 1052 students were not initially offered a seat and the mean rank students gave for the seats they were ultimately offered was 1.131 (11.120 if unmatched students receive their rank 13). This constitutes an improvement of 31.4%, 1.0%, 41.5%, and 0.3%, respectively.
This is a back of the napkin estimate from https://www.schools.nyc.gov/about-us/reports/doe-data-at-a-glance and https://data.nysed.gov/enrollment.php?state=yes↩
Well, simple to vaguely describe, it still took some time to make an (almost) airtight algorithm.↩
As “all” students receive an offer, these students would eventually receive offers at a school that they did not rank and that had empty seats remaining.↩
I haven’t yet run this enough times to state that these are robust results.↩
“Rank search depth” of 2 means that there is a logjam, no school can make an offer to the first student in their ordering according to the student’s first remaining preference, nor second remaining preference, but yes to one student’s third remaining preference. Once the logjam is broken, the algorithm returns to evaluating matches according to students’ first remaining preference again.↩
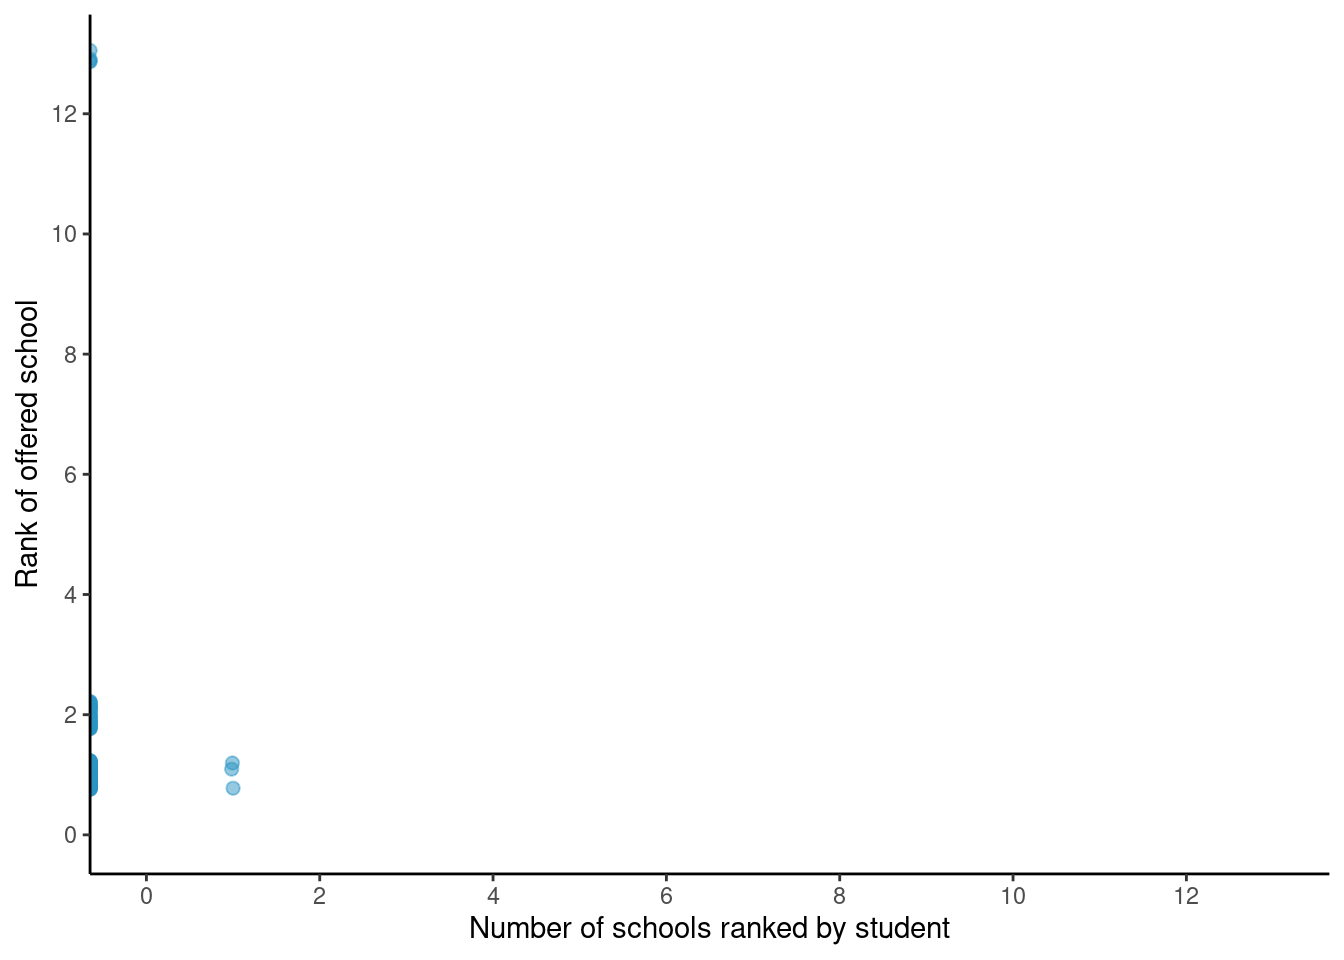
You can see something is odd here in that some students allegedly ranked only one school even though the minimum is supposedly two.↩
Joseph de la Torre Dwyer
Researcher
My research interests include distributive justice; the principles of responsibility, desert, and control; and reproducible research with R.